Where Heromotoco headed in the Aftermath of the budget & results
Hero Motocorp Ltd result brought a little disappointing numbers in Q3FY19, a revenue of 7864cr from Q2FY19 9090cr, but on a YoY basis, Hero clocked a moderate growth in revenue from 7305cr to 7864cr.
Experts quite expected the moderate growth but failed to see 13.48% lower than last Q2 fiscal numbers, led the net profit to 769cr from Q2FY19 976cr, A shock of 21.2%.But company increased their infrastructure, investing on innovation, brought many new bikes & scooty in the market, such as hero goodlife, destiny 125, Maestro edge that gained market share in scooty segment. Extreme 200r in sports bike segment, & new super splendor which is best for those who ask for mileage. And many more to come.
So, where the hustle that led the growth slumped and overall was gave net profit down 21.2% from last Q2FY19. Many reasons are considered, but some of them are increased fuel prices, a rise in interest rates to 6.5% from 6% & 6.25% consecutively, also higher compulsory insurance price & weak demand due to competition & rise of unemployment, rise of raw material price.
Seeing Good outlook in coming quarters. Company revealed new products for sports bike fan, Xpulse & Extreme 200R, 200 cc segment. Consumptions rose to 5475cr this Q3 from 5000cr YoY basis.
Despite slowed volume and net profit, company gaining market share & build an optimism for the company outlook & made Hero a trustworthy brand of the country.
On this 15min chart, we can see price making reversal to upside from downtrend, price went below 2600 before earnings and headed to 2850 level. Forming inverted head & shoulder.
Many reversals & continuation patterns can be observed in this chart 1, such as EMA crossover, 123 breakout, TSI positive divergence, and most important, forming inverted head & shoulder reversal, also, constant rise in volume, depicting confirmed reversal.
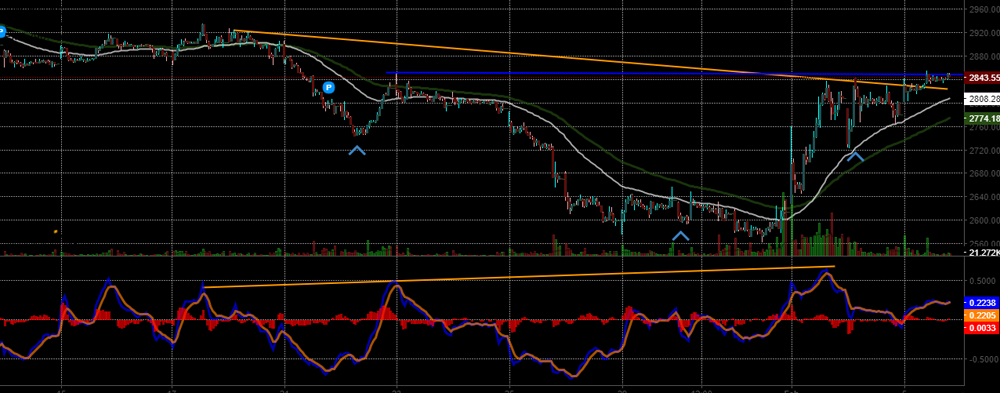
Chart 1. 15min, Heromotoco, Jan 2019 to present.
Describing Levels & Patterns:
Head & Shoulder.
Head = 2560
Left Shoulder Level = 2730
Right Shoulder Level = 2720
Neckline Breakout = 2815
Neckline Slight Slanting towards downtrend which makes the pattern significant.
Crossover of EMA 50 & EMA 90 near 2640 with confirmation of positive divergence.
Constant Volume & price rise observed in the chart.
On this daily chart, we can see the price trending down from sept 2018, price reaching below to 2600 from 4000 level, making channel that eventually expanded.
Support near 2550, forming double bottom if price crosses EMA 50 & 90.
Many reversals & continuation patterns can be observed in chart 2, positive divergence, Rising volume when price retraced 40% from 2550 to 3380. Although, slow EMA constantly trending down but can expect to retrace 3150 to 3200.
Indicators: TSI & Volume.
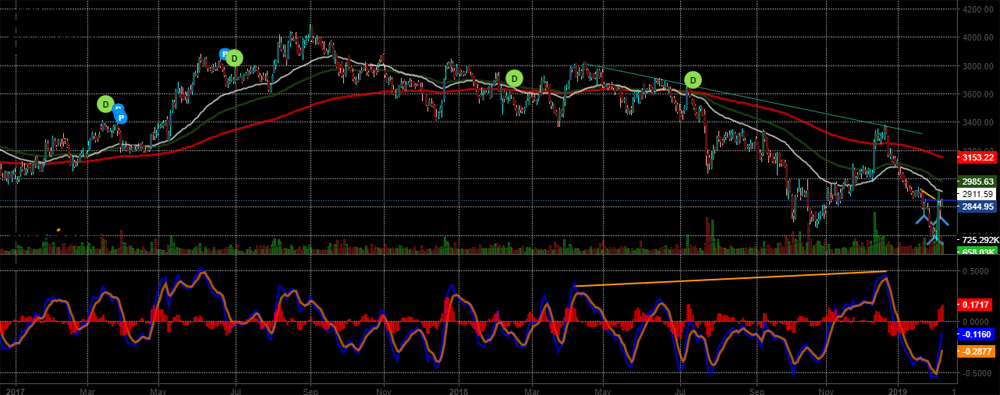
Chart 2. Heromotoco, Daily, 2017 to Present.
Observing relativity in this chart of Bajaj, Hero & Nifty.
Green line is Bajaj-Auto.
Blue Line is Nifty 50 Index.
Candle is Heromotoco.
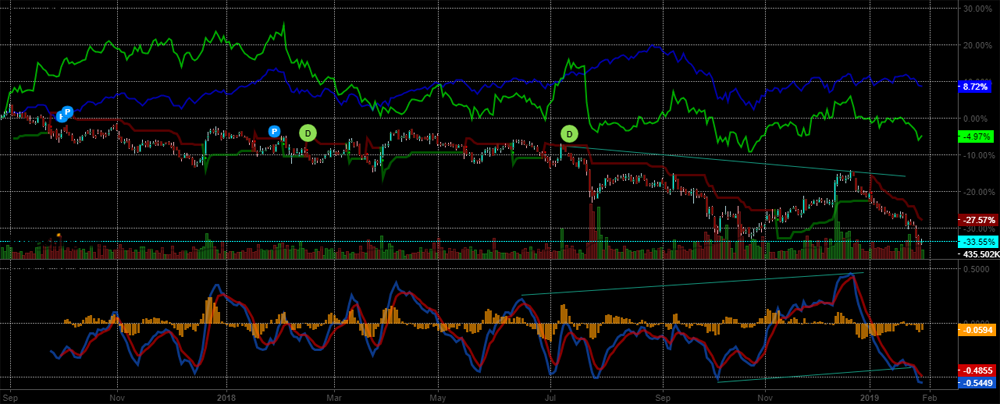
Chart 3. Hero, Bajaj, Nifty, Daily, Sept 2017 to present.
We can see how Heromotoco underperformed since 2018 and Bajaj is moderate while Nifty hovers above 8%.
Despite the gap ratio of heromotoco & bajaj, we can expect this gap ratio to contract and hero to retrace near level of 3100 and upside towards 3150.
Heikin Ashi chart 4.
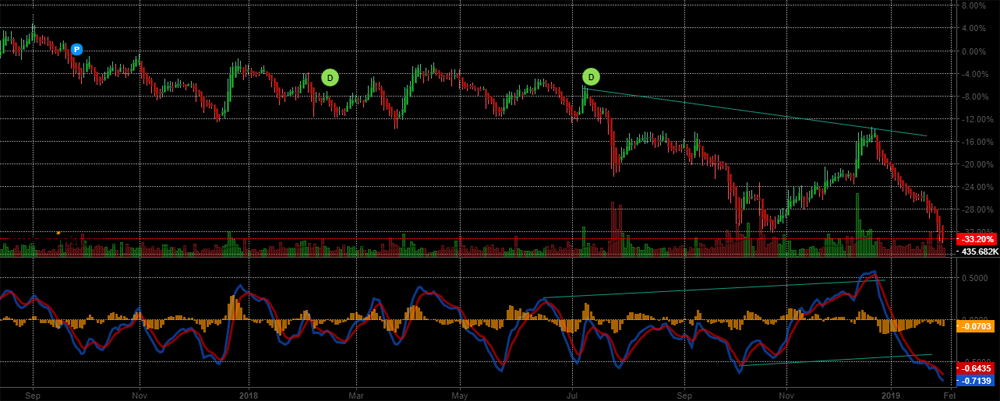
Chart 4. Hero, Heikin Ashi chart Sept 2017 to present.
Author:
Leave a Reply
Your email address will not be published. Required fields are marked *
